Web scraping and analyzing 400,000 articles
Apr 4, 2018 00:00 · 560 words · 3 minute read
In this post i will analyze the articles published by NEWSBEAST, one of the main on-line publishers in Greece. The main question is “Are there any trends on the daily posting frequency of NEWSBEAST?” The steps below were followed before the main data analysis (link for the full r code can be found at the end of the article):
- Scraping the articles from the site (www.newbeast.gr) using rvest & car libraries in R
- Data preparation (including data cleansing, transformation)
- Exploratory analysis
MAIN DATA ANALYSIS
Let’s create a scatter plot to see the number of articles published per day for the last 4 years.
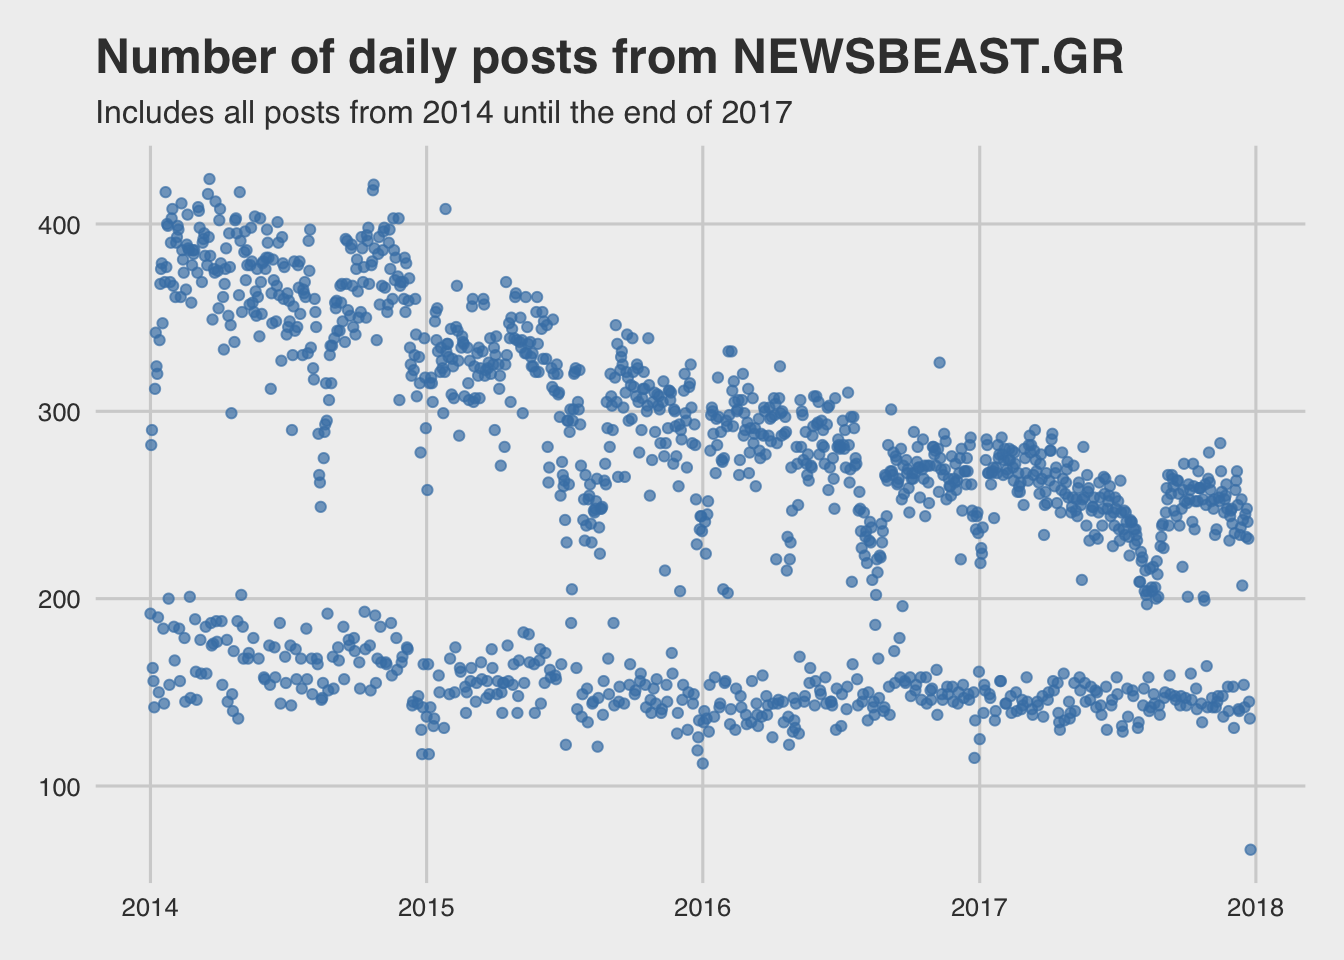
We can spot clearly that there is a constant trend (during the last 4 years)
of two different patterns on number of daily articles published. We suspect that
on specific weekdays (maybe weekends?) there are significantly less published daily articles.
A second trend (not so clear) could be that each consecutive year less articles
are published.
Now let’s plot it again by distinguish each week day with a different color for a more clear view.
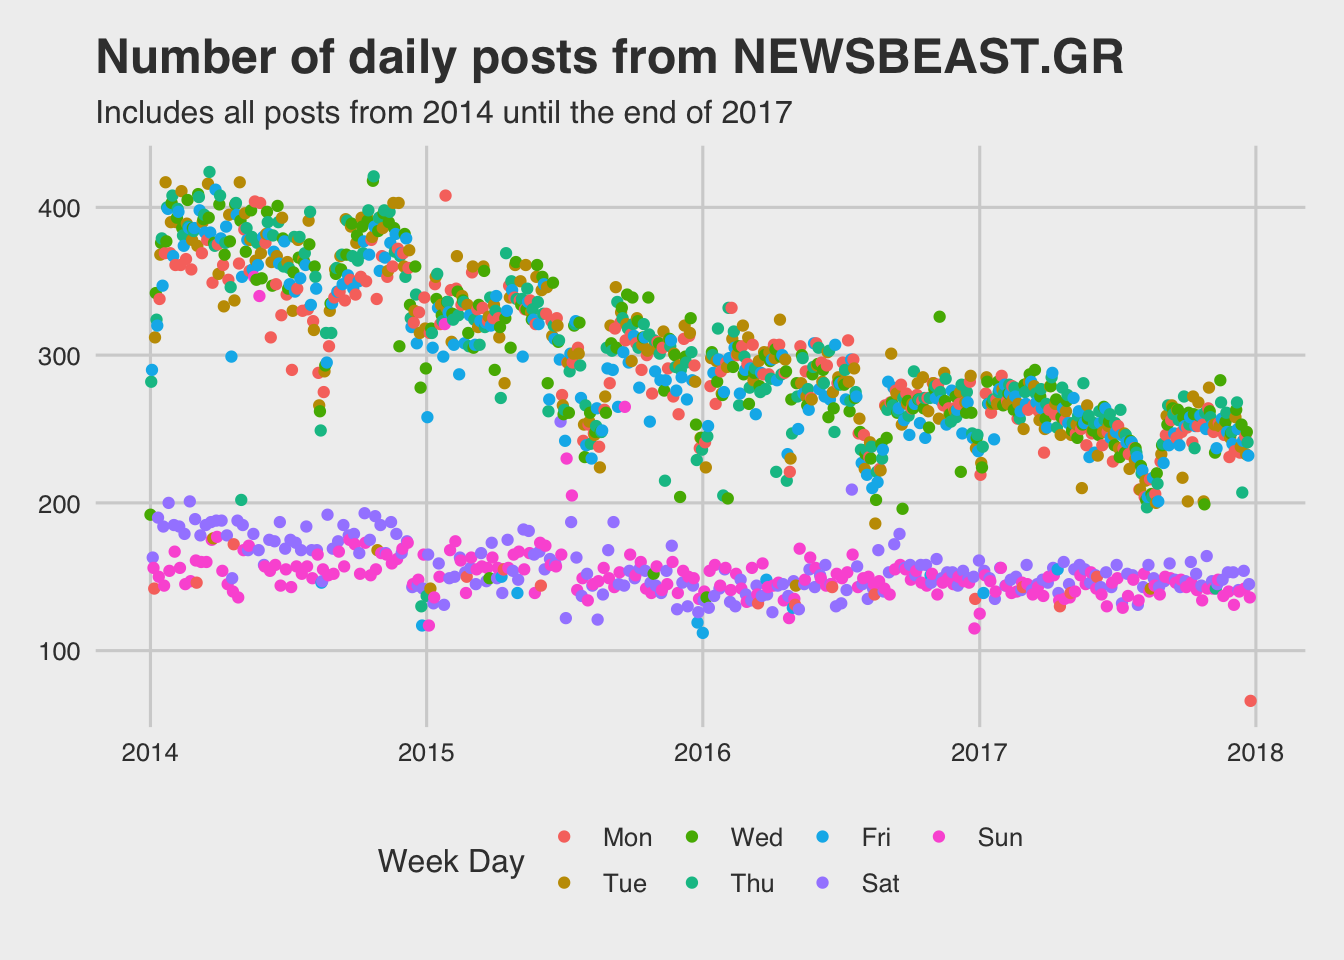
So now it is clear that during the weekends the number of daily posts are much lower than on work-week days.
MODELLING
Now let’s try to fit a model on each week day and create a plot to present these. In the plot below each weekday is presented by by fitting a separate smooth line using LOESS regression
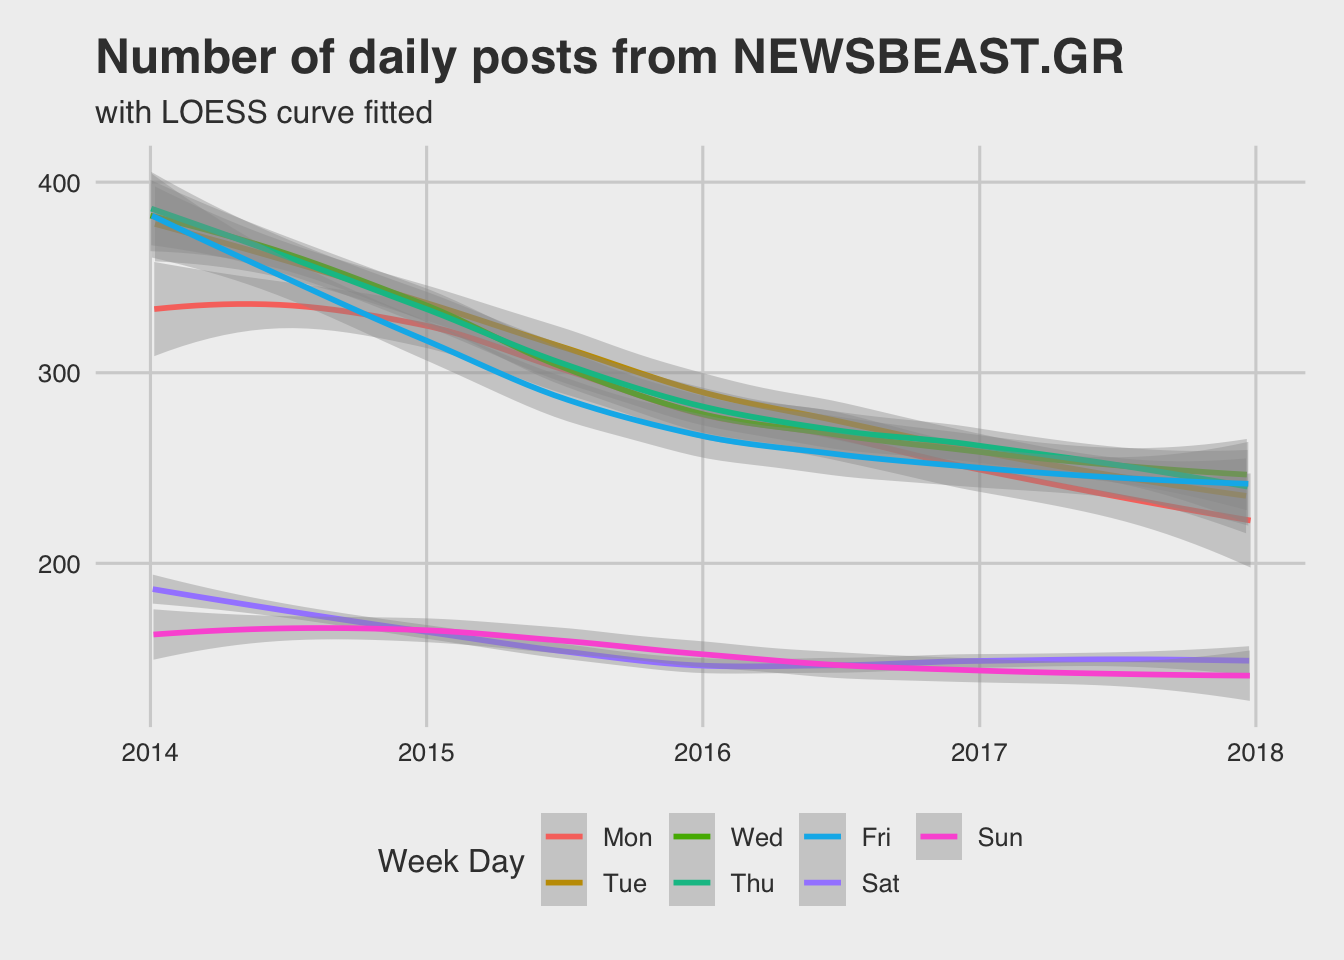
The standard error for weekend days (95% confidence level) indicates that the difference from the work-week days is significant.
Now let’s investigate if there are significant differences between different years.
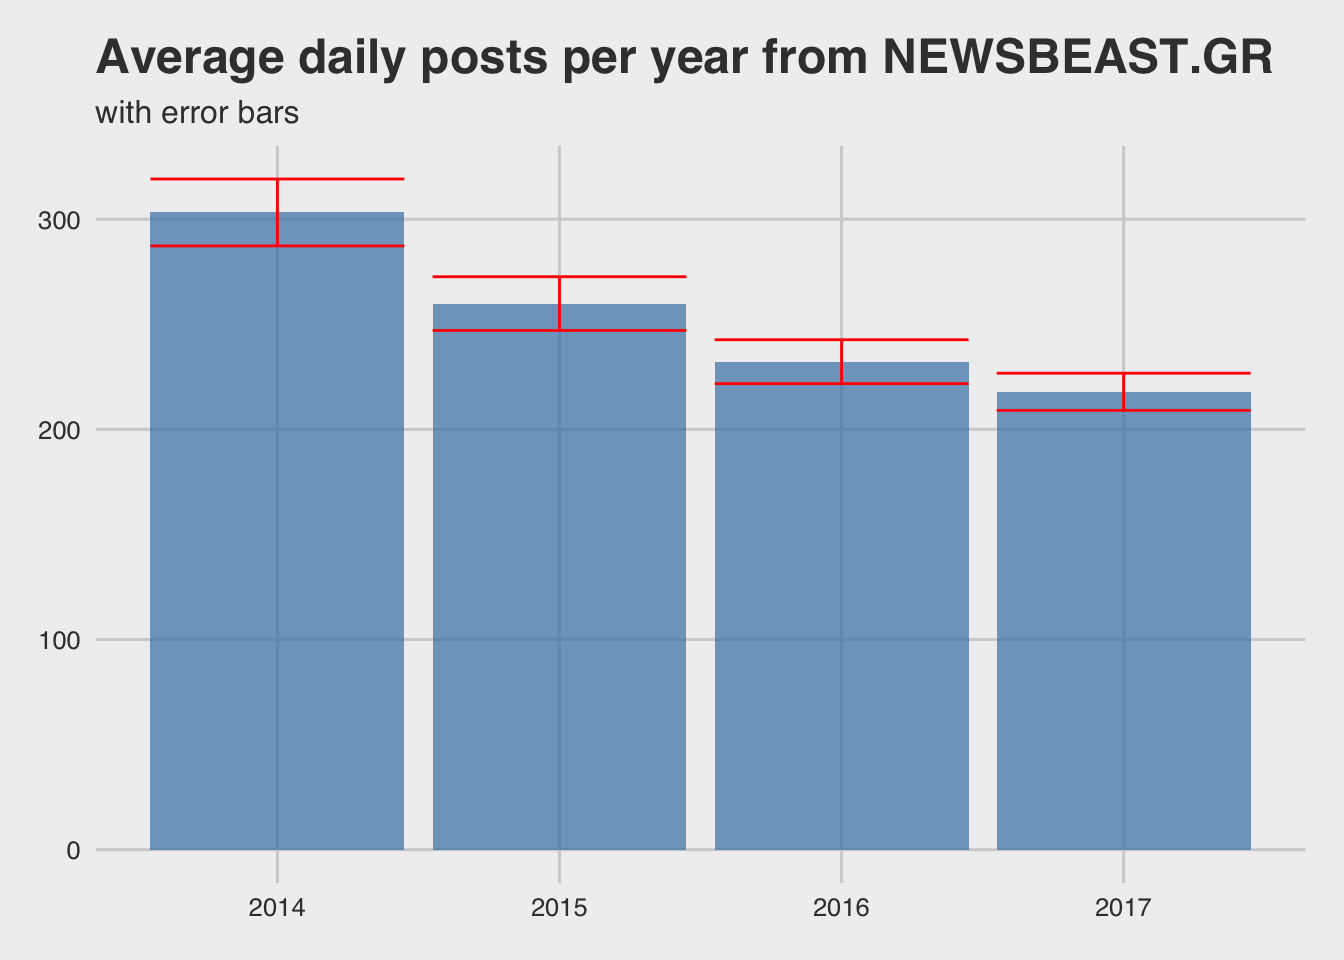
By looking at the error bars it looks that all differences (between years) are statistically significant, except when comparing 2016 with 2017 were the error bars are overlapping.
This finding can be confirmed by applying the non-parametric Wilcoxon signed-rank test in different samples (table below)
| Wilcoxon test between Years | p-value |
|---|---|
| 2014 - 2015 | < 0.001 |
| 2015 - 2016 | < 0.001 |
| 2016 - 2017 | < 0.001 |
All p-values are very low (<0.01) with confidence level of 0.95, so the difference in daily mean articles posted is significant.
TIME SERIES ANALYSIS
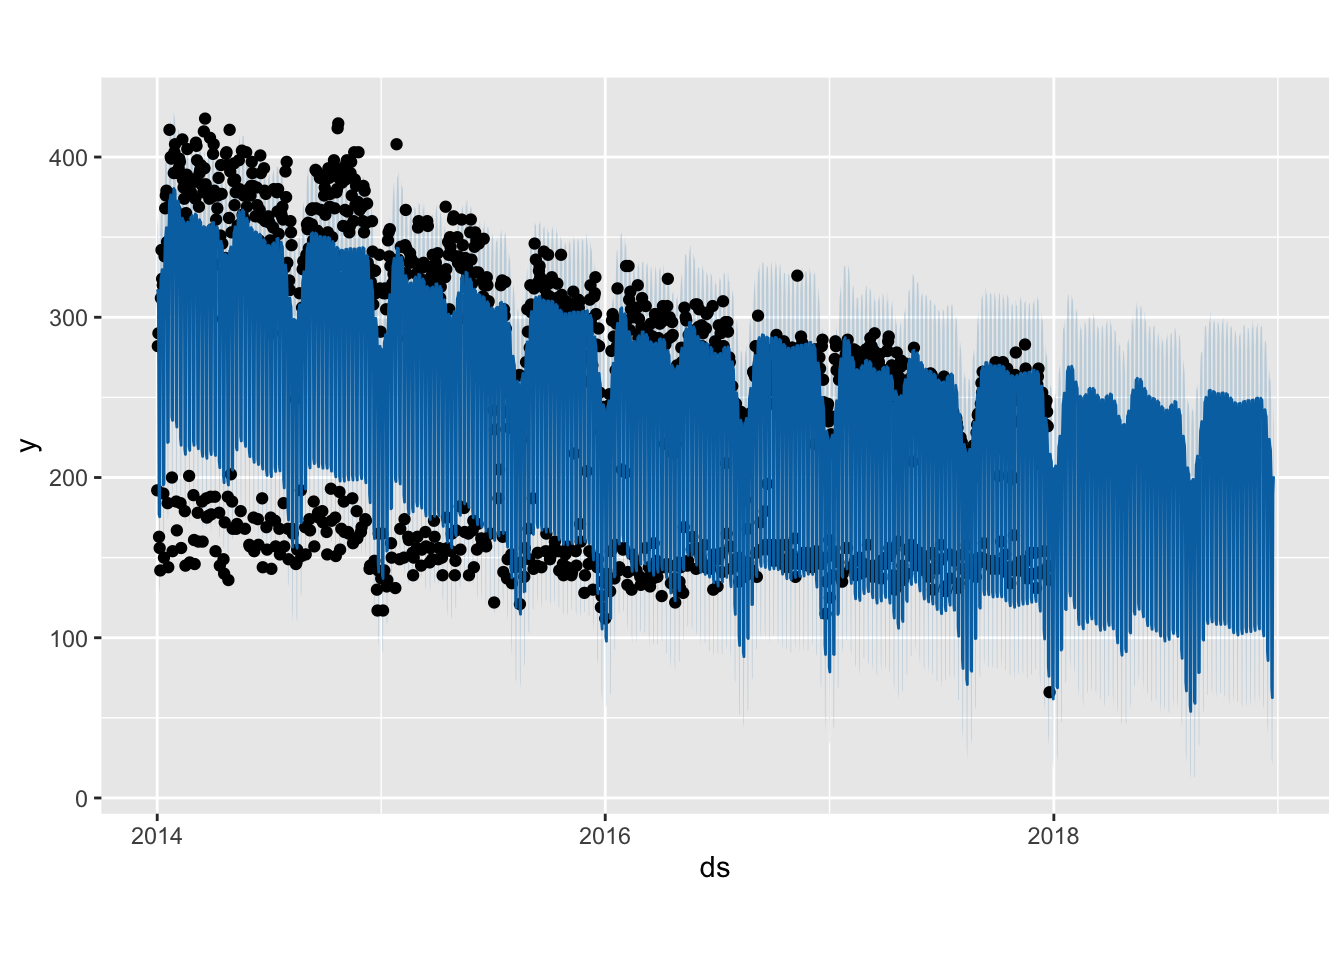
Finally in order to investigate other, less obvious seasonal trends, we used a package dedicated on time series analysis. Using the prophet package for R a forecasting model was fitted, as can be seen below, which revealed more seasonal trends. In particular two major “drops” appear in daily articles around the christmas period and the summer holidays (around August). There is also a minor “drop” around the Easter period.
The other useful feature is the ability to plot the various components (plot below) It is a simple way to pull out the daily/weekly/yearly trends. In particular in the chart below we can easily spot the drop on the weekends, the “drops” in daily articles around the christmas period, summer holidays, Easter period and the yearly “drop”.
prophet_plot_components(m, forecast)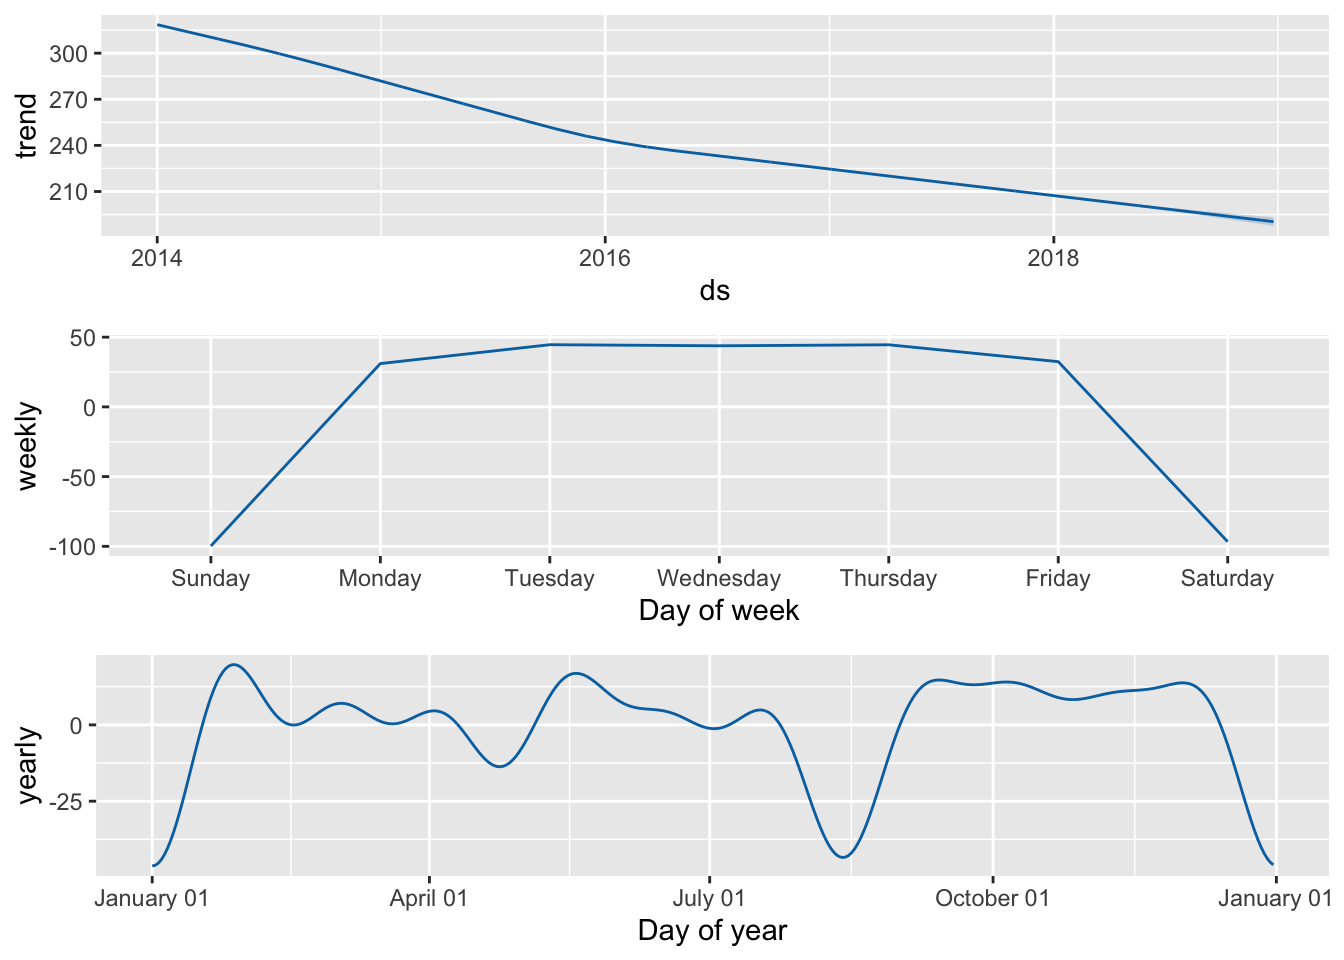
CONCLUSIONS
There are various outcomes from this analysis on Newsbeast.gr. In particular:
- During the last 4 years there is a significant decrease on daily posted articles. Overall around 30% less articles.
- The published articles during the weekends are much less than on weekdays.
- There are 2 major “drops” in daily articles each year, during the Christmas & summer holidays.
- There is a minor “drop” in daily articles published each year during the Easter holidays